Product Mix
In CY 2024, the Southeast Asian seafood market was characterized by a strong preference for live, fresh, and chilled products, which accounted for ~66% of total effective consumption. Frozen products contributed ~18%, supporting extended shelf-life and consistent availability. Additionally, dried, smoked, or salted items represented ~11%, while other preserved or processed preparations comprised ~5% of total effective consumption. These figures are largely in line with CY 2019 levels, when live, fresh, and chilled products made up ~64%, frozen products ~19%, dried, smoked, or salted items ~12%, and other preparations ~6%, indicating relative stability in consumption patterns over time.
Channel Mix
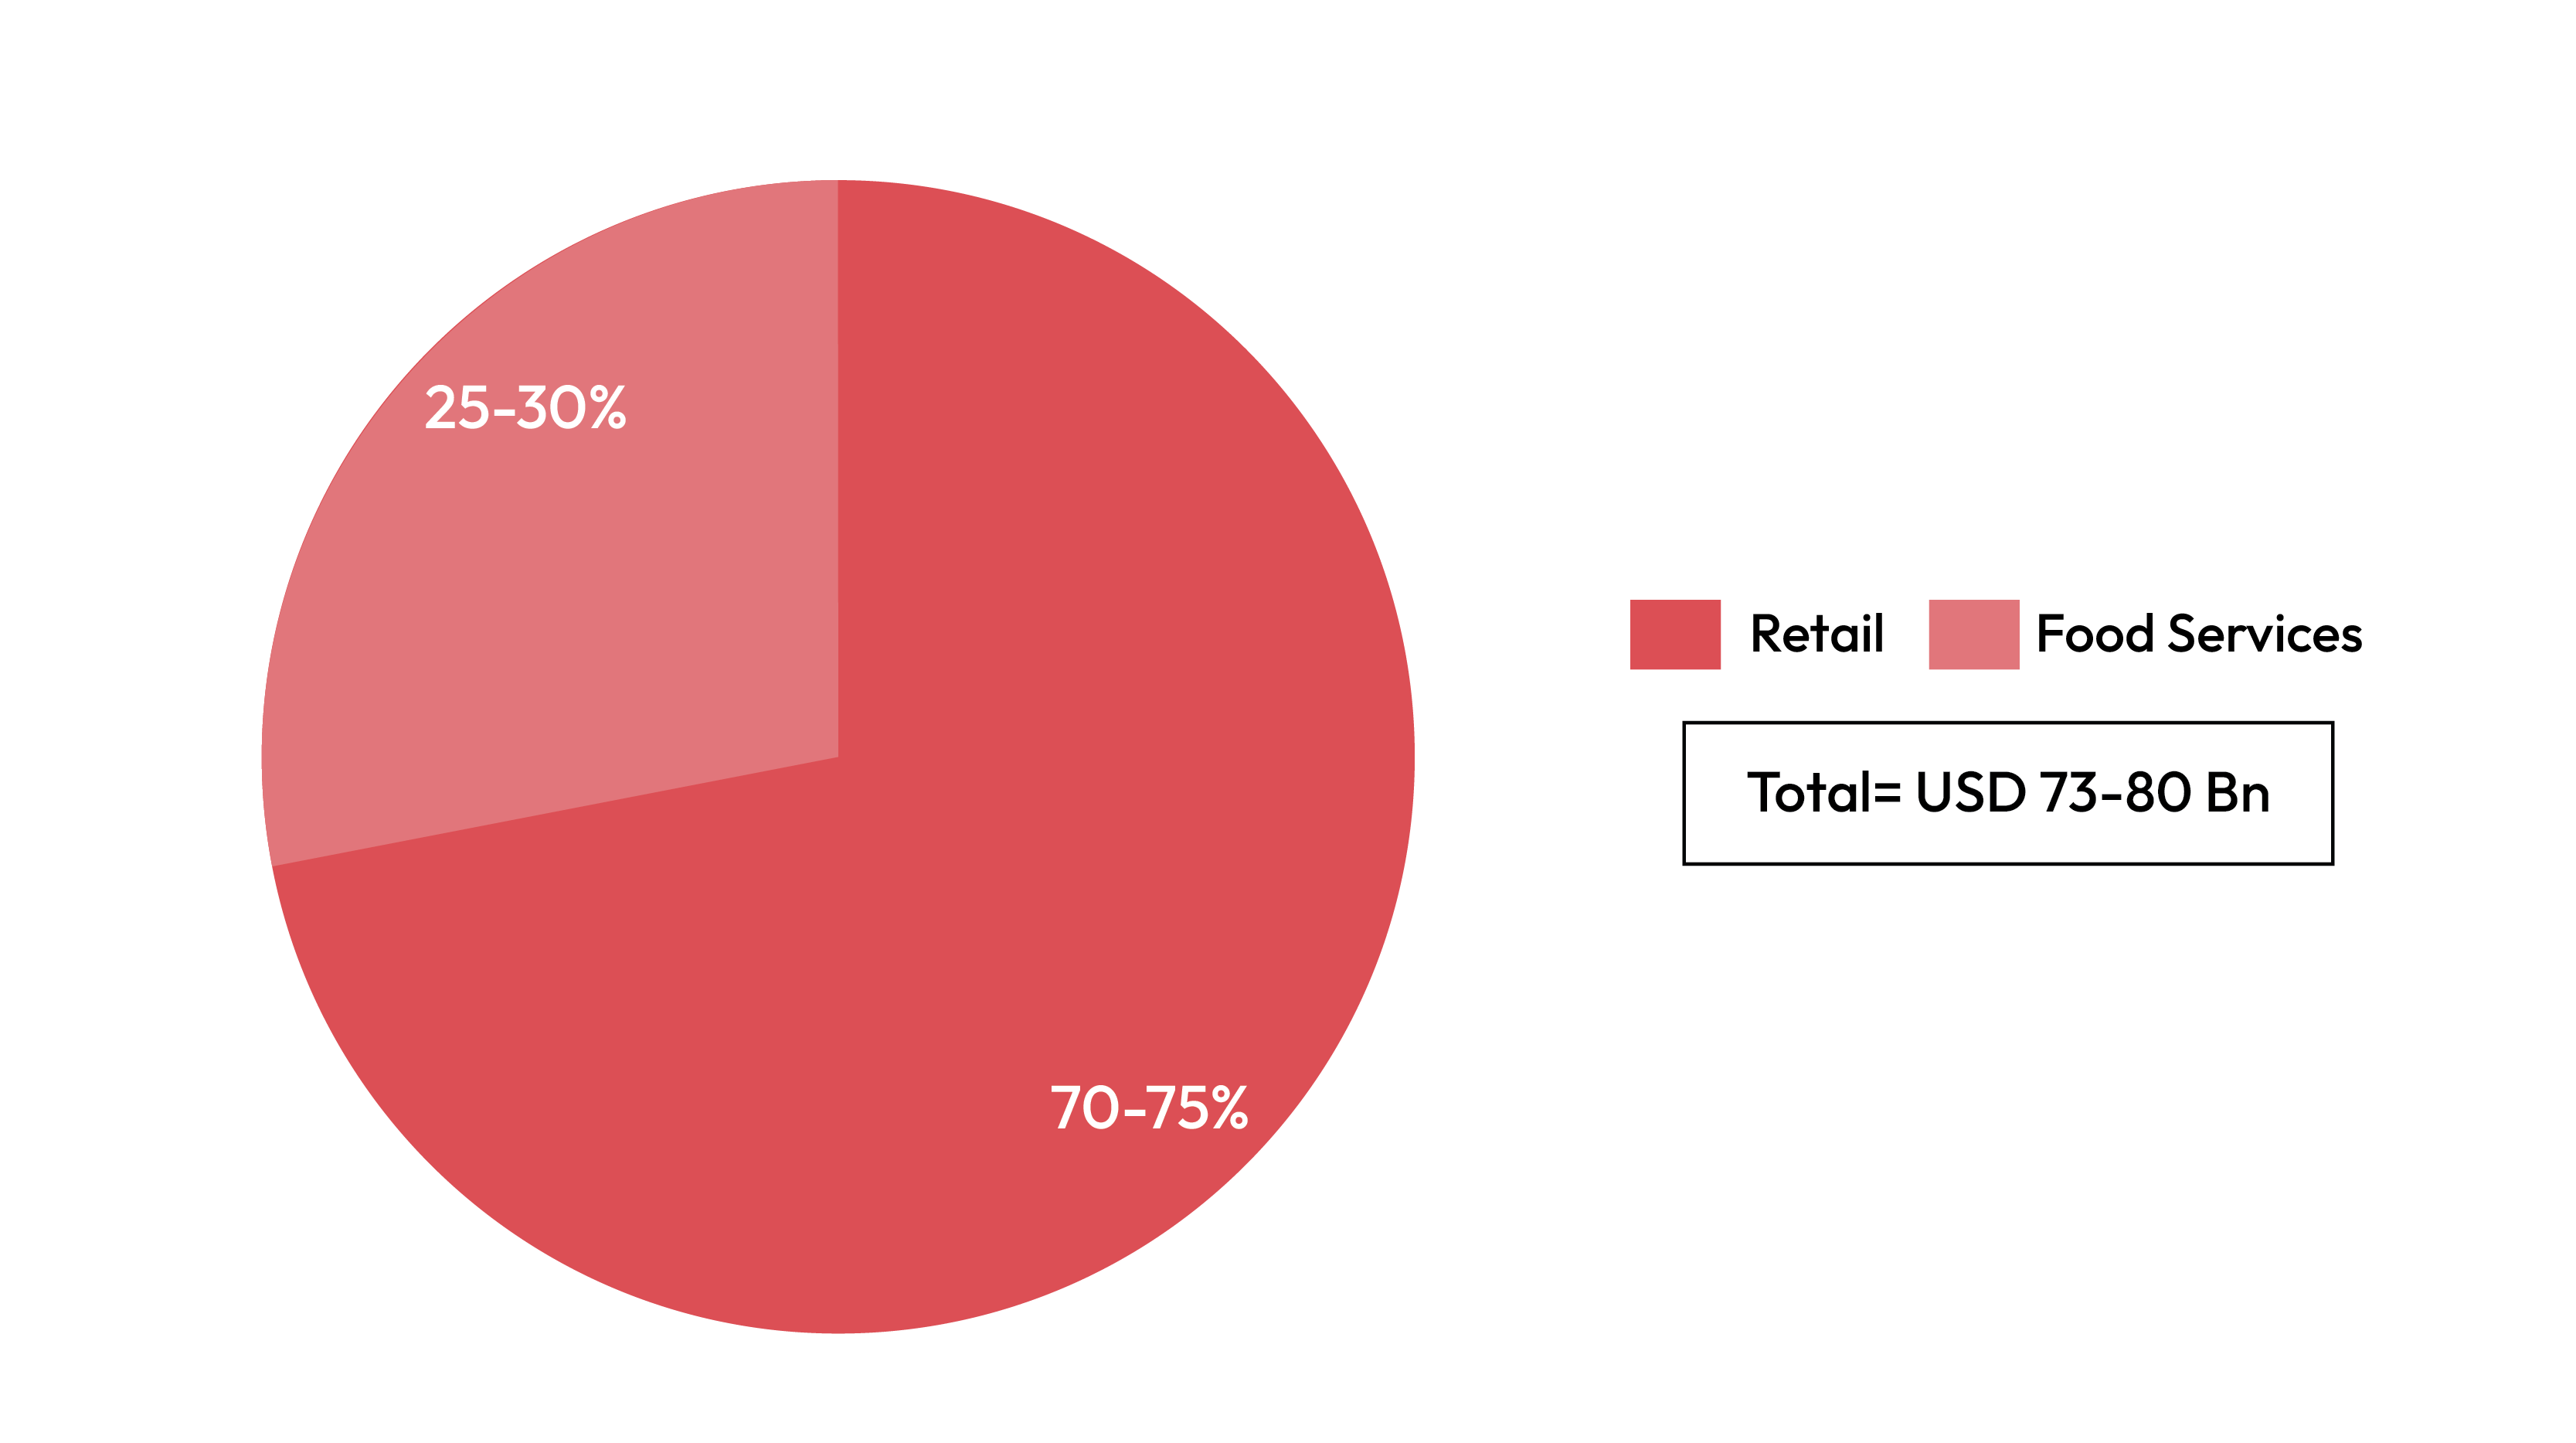
The structure of the Southeast Asian seafood market varies by country, but traditional wet markets remain a key distribution channel in many regions. However, organized retail and e-commerce platforms are gaining traction in urban centres, where supermarkets and digital seafood marketplaces are providing consumers with a wider variety of products. The B2B segment, which includes food service providers, restaurants, and institutional buyers, continues to be a sizeable driver of demand, with the B2C segment expanding due to growing retail penetration and online seafood sales. Within the retail segment, traditional independent outlets represent 75-85% of the market, while modern trade channels (including supermarkets and hypermarkets) account for 12-16%, and online retail comprises 3-9%. In the food services segment, restaurants hold 65-75% of the market share, with institutional buyers constituting the remaining 25-35%.
Changing Consumer Behaviour
Seafood consumption in Southeast Asia is driven by strong cultural preferences, high per capita intake, and the dominance of aquaculture in regional supply chains. Countries such as Indonesia, Vietnam, Thailand, and the Philippines have well-established seafood consumption habits, with a preference for fresh and locally sourced seafood from wet markets. Sustainability is becoming a key focus, particularly for export-driven industries, as traceability and eco-certifications gain importance in international markets.
Source(s): Redseer research and analysis