In order to meet the rising demand for seafood, fisheries globally have been adopting aquaculture. Over the past two decades, the global seafood supply has shifted from being predominantly wild-caught to an increasingly farmed industry. This is evident in the rising share of aquaculture in total seafood production, which has increased from 31% in CY 2004 to 53% in CY 2024, growing at a CAGR of 4.6%. In contrast, wild capture production has remained largely flat. A principal factor underpinning aquaculture’s rising prominence is the range of supply-side constraints confronting wild fisheries. Habitat degradation, ecosystem imbalances, and environmental fluctuations collectively impede the replenishment of wild fish stocks, while regulatory measures—such as stricter catch quotas, gear restrictions, and seasonal or area-specific prohibitions—further limit growth in wild-capture operations. In contrast, aquaculture benefits from controlled breeding, optimized feed strategies, and advanced disease-management protocols, enabling higher and more predictable yields. This controlled production environment supports year-round output that mitigates natural variability and circumvents many limitations inherent to capture fisheries. Consequently, aquaculture not only addresses these supply-related challenges but also reduces fishing pressures on wild stocks, thereby contributing to the sector’s long-term sustainability objectives.
Supply Insights
)Global Seafood Supply by Species
Seafood can be broadly categorized into four major groups: Finfish, Crustaceans, Molluscs, and Others. From a species standpoint, finfish remains the dominant category contributing to ~57% of the market (in value terms) as of CY 2024, followed by crustaceans at ~26% contribution, and molluscs at ~15%, while others contributed to the remaining ~3% of the total global seafood distribution market. Freshwater finfish remains the leading category within finfish, contributing approximately ~34% to the market, followed by demersal at ~24%, pelagic at ~20%, diadromous at ~16%, and other finfish categories at ~7%. In terms of market volumes, finfish contributed to ~77% of total effective seafood consumption, estimated at 111-123 million tonnes in CY 2024 and projected to reach 122-135 million tonnes by CY 2029, growing at a CAGR of ~2%. Crustaceans are projected to see a modest increase in share, rising from ~8% to ~9%, with a CAGR of ~3% between CY 2024 and CY 2029, indicating steady demand growth. While molluscs maintain a 13% share, reflecting stable market conditions, and the share of other aquatic animals remains marginal. Freshwater finfish remains the leading category within finfish, contributing approximately 46% to the market, followed by pelagic at 26%, demersal at 15%, diadromous at 5%, and other finfish categories at 7%.
Rising share of aquaculture across all species
Aquaculture trends by species
Finfish, which dominate global seafood output, are nearly evenly split between wild capture and aquaculture. While species like tuna, pollock, and cod remain primarily wild-caught due to challenges in large-scale farming, aquaculture has become the primary source for species like salmon, tilapia, and carp. The farmed share of finfish production has steadily increased over the past two decades, now accounting for over 46% of total finfish supply in CY 2024, driven by efficiency gains and growing demand for controlled, sustainable sources. Crustaceans, historically reliant on wild-capture fisheries, have seen a dramatic shift toward aquaculture, particularly for shrimp. Farmed crustaceans now make up over 70% of total crustacean supply, fuelled by rising consumer demand and advancements in disease-resistant breeding techniques. Molluscs, led by bivalves such as oysters, mussels, and scallops, have experienced some of the highest levels of aquaculture adoption. Over 77% of global mollusc production now comes from farmed sources, with bivalve farming playing a key role in both seafood supply and environmental sustainability through water filtration benefits. Cephalopods, in contrast, remain overwhelmingly wild-caught, with squid and octopus harvests fluctuating due to environmental conditions and stock management efforts.
The seafood value chain is highly fragmented and complex, varying across the major species such as finfish, crustaceans, molluscs, and other aquatic animals, with distinct harvesting, processing, and distribution stages, leading to significant value pool and margin distribution among the intermediaries.
The fragmented seafood value chain creates significant operational challenges across stakeholders. It involves numerous intermediaries—from fishermen to processors, distributors, and retailers—operating in disconnected networks across geographies. This disjointed structure leads to inefficiencies in traceability, inconsistent product quality, and higher costs. Moreover, the diversity of species and varying processing requirements further complicate coordination efforts. The lack of standardized systems and tools exacerbates these issues, resulting in operational bottlenecks that impact operations and profitability. Building on these systemic challenges, each stakeholder in the seafood value chain faces unique operational hurdles that affect their efficiency and profitability.
Source(s): Redseer research and analysis; Food and Agriculture Organization of the United Nations
Seafood Distribution Market Size – by Species
(USD Bn, CY 2019, 2024, 2029P)

Note: This includes both food and non-food consumption and excludes exports
Finfish Distribution Market Size – by Subspecies
(USD Bn, CY 2024)
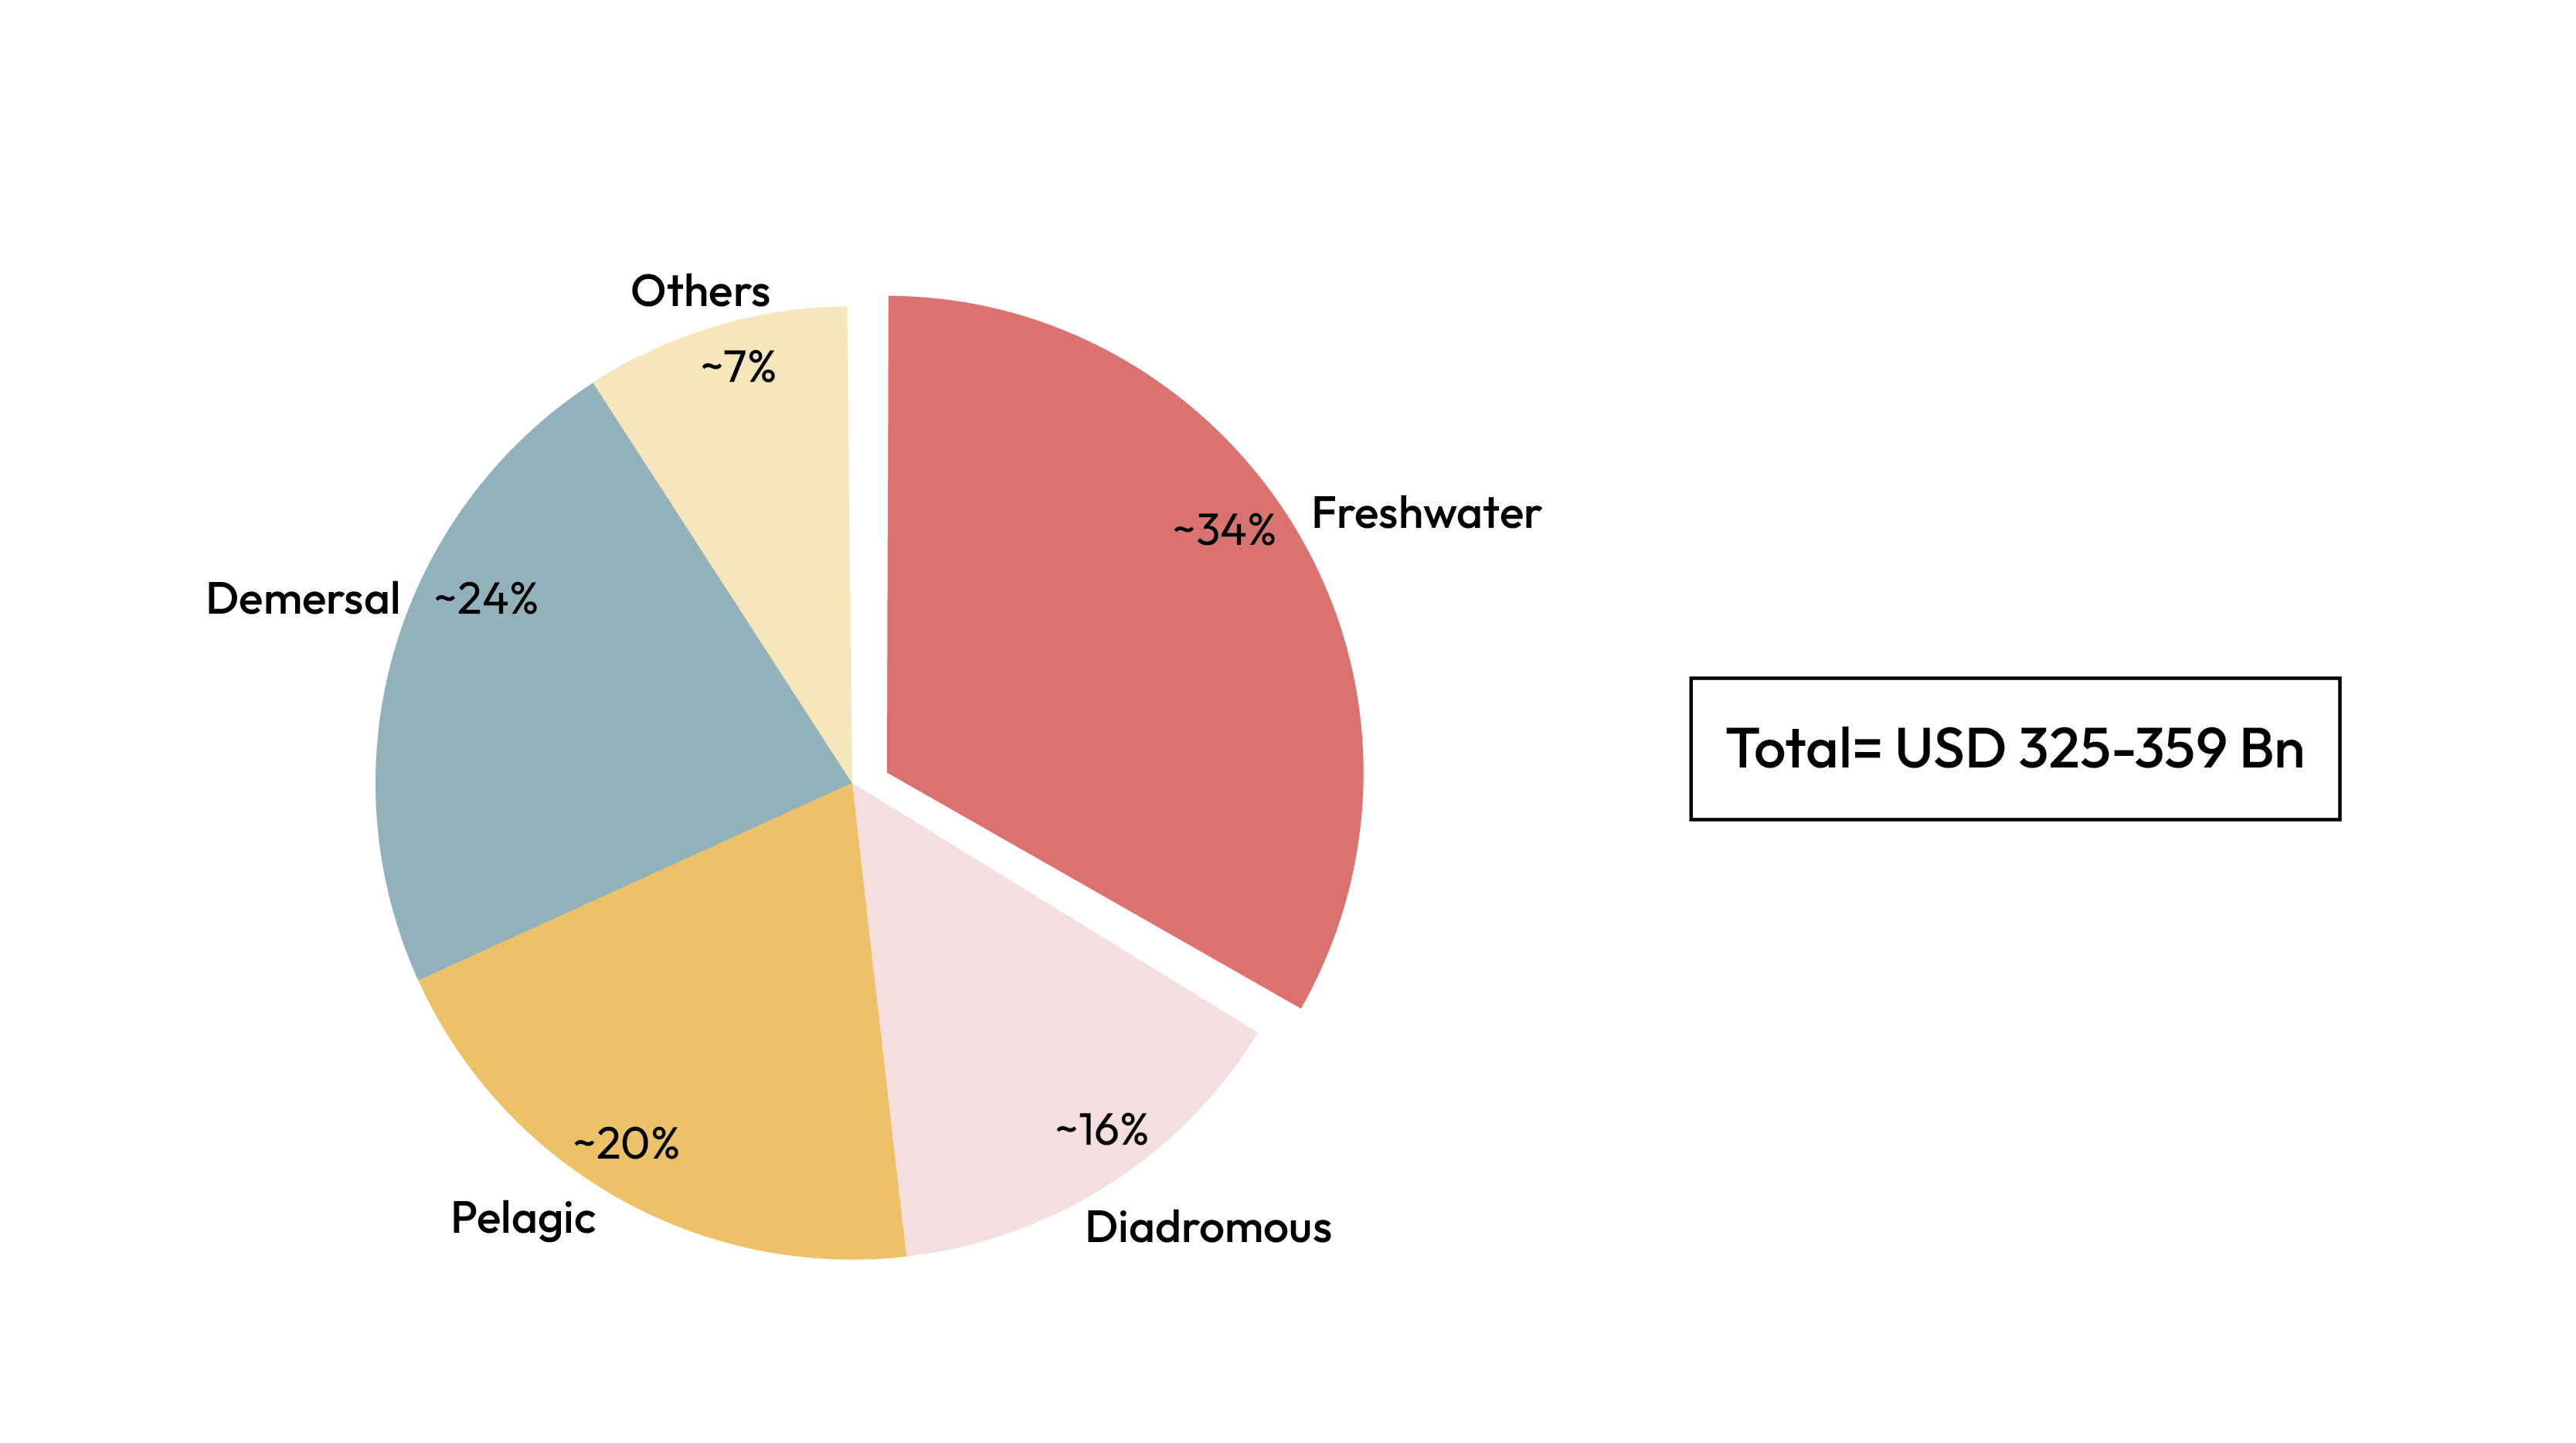
Note: Total market size of USD 325-359 Bn
Exhibit 6a: Seafood Distribution Market Volume – by Species
(Mn Tonnes, CY 2019, 2024, 2029P)

Note: This includes both food and non-food consumption and excludes exports
Exhibit 6b: Finfish Distribution Market Volume – by Subspecies
(Mn Tonnes, CY 2024)
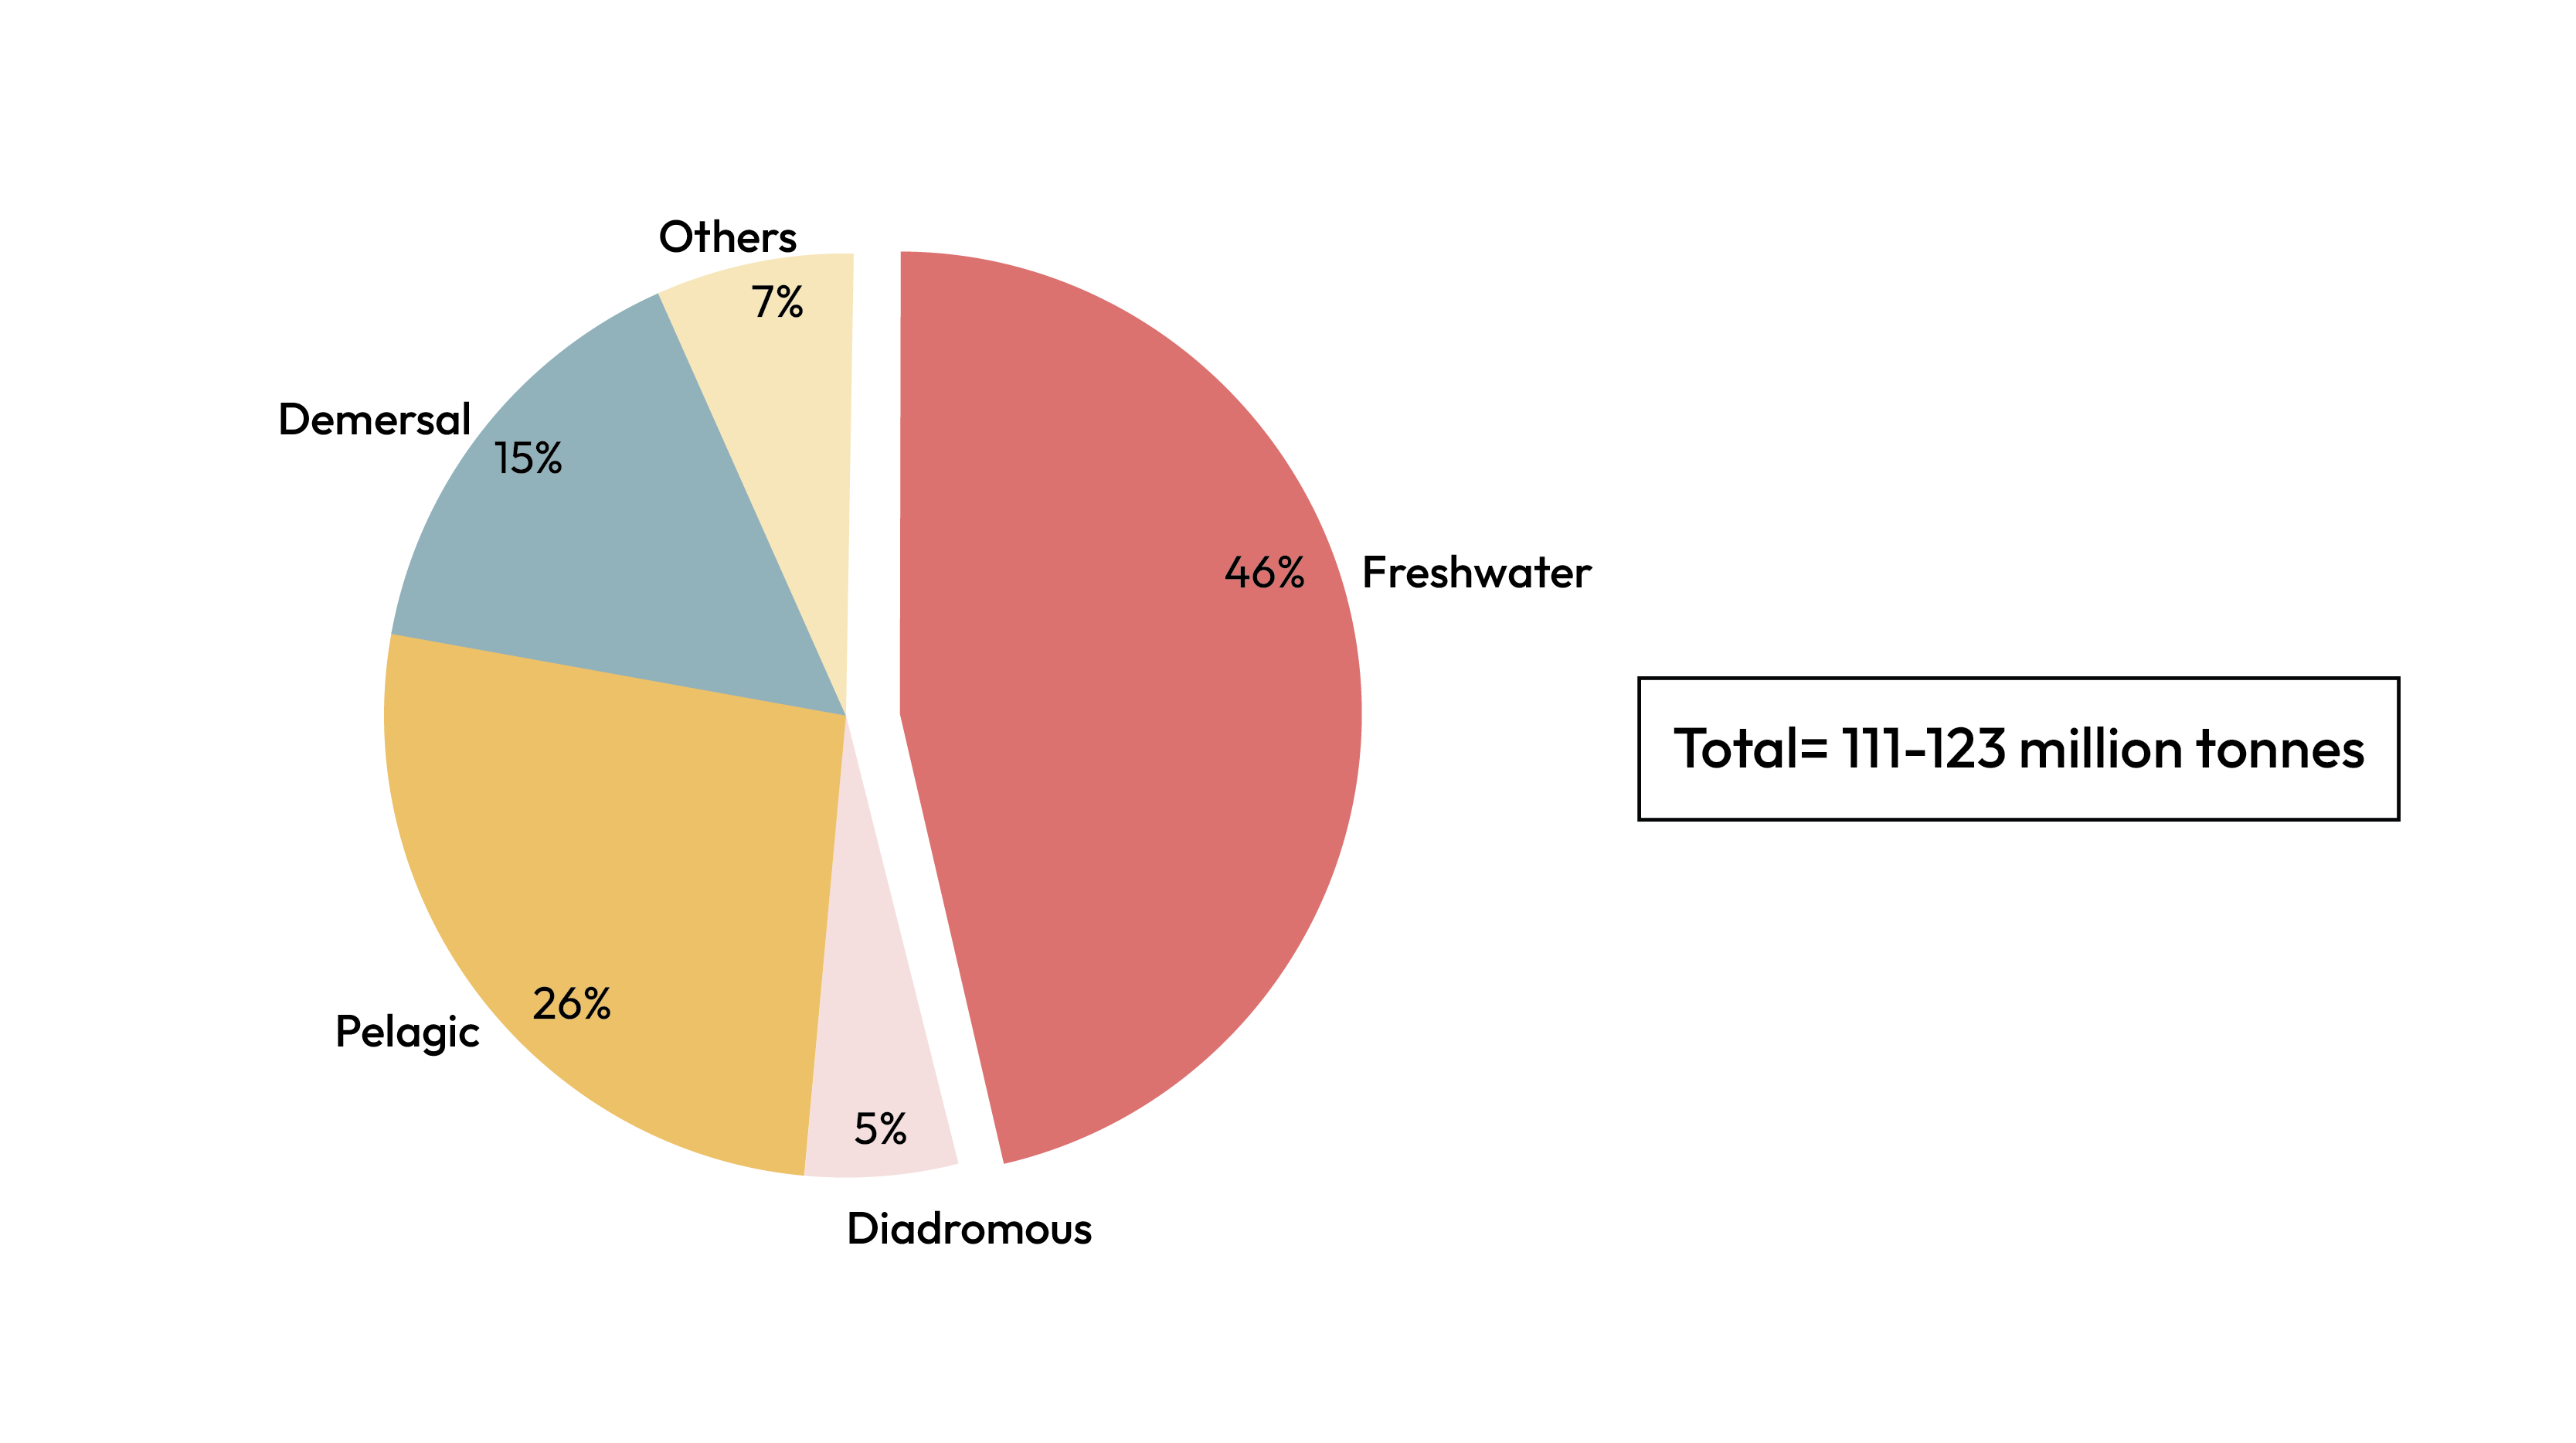
Note: Total effective consumption of 111-123 million tonnes
Exhibit 24: Global Aquaculture and Wild-Capture Production – by Species
% of global production (in million tonnes), CY 2024

Source(s): Food and Agriculture Organization of the United Nations